It has been a little over 6 months since Google Analytics migrated to their new interface. If you receive scheduled reports from us you will have noted some significant changes to the report you receive. In the past you would have received an entire dashboard report normally in the region of 8 – 10 grouped pages. This was a good report for most clients since it provided a comprehensive overview of their website traffic patterns. After the initial migration you would have received a single-page Dashboard Overview, and now you are receiving a selection of PDFs of different tracking types chosen per your specific tracking needs.
This new format is not ideal, but what you need to understand is that the new Analytics only exports what is on screen for a given report type. To get a comprehensive overview report each report must be individually selected and then assigned to the email account as an export option.
At this point it is important to note that the PDF export version has been released under the “beta” designation which means that there’s still room for improvement…yes, we agree. We found this out on our first attempt using it – firstly, the reports being sent out arrive as individual PDFs (having a grouped report is the most effective option here), and there is no way to delete a report from an account without deleting all of the scheduled reports. Really? That being said I do appreciate the many services that Google offers, and being that Analytics is free to use and has some really great tracking features I’ll keep my criticism to a minimum.
Ok, so for those of you who would like to know more about the report options available the following information is for you. When evaluating your own reports you may find that you don’t want all that has been provided, or feel that other reports not yet provided are needed. If this is the case please contact us so we can modify the reports you do receive. Thank you for being patient with this transition, and of course for being a client!
When you arrive at Analytics you will note the three tabs at the top (Home, Standard Reporting, and Custom reporting). Both “home” and “standard reporting” provide overview statistics of traffic and usage.
- Custom reporting, as you would expect, is for creating custom report types.
- The Standard Reporting section has an additional left-column navigation that provides the different default tracking options. As noted above one would select the ones of interest and then assign them to an email to be exported, or to a scheduled report email.
The Standard Report tracking options include: Audience, Advertising, Traffic Sources, Content, and Conversions. Each of these are sub-divided as follows:
AUDIENCE
- Visitor Overview (the standard reporting home screen)
- Demographics: Language, Location
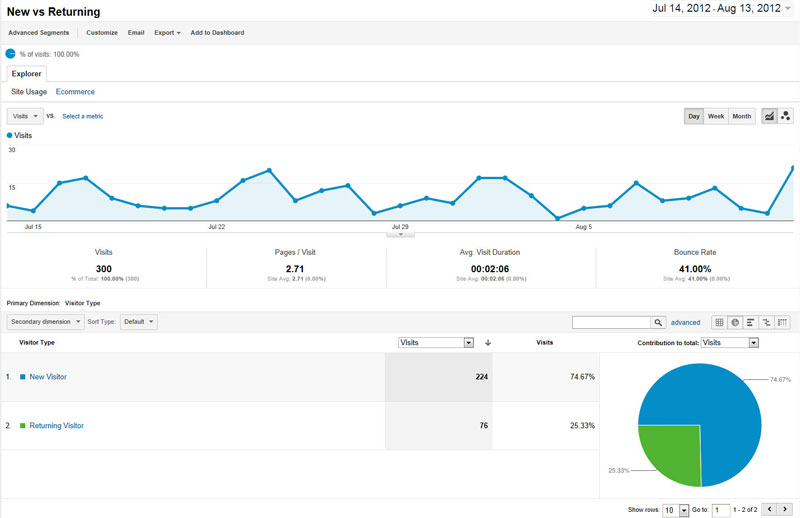
- Behavior: New vs. Returning, Frequency & Recency, Engagement
- Technology: Browser & OS, Network
- Mobile: Overview, Devices
- Custom: Custom Variables, User Defined
- Visitor Flow
This is a great place to get an overview of your website’s visitor needs, practices, and experience on your website. Here you’ll get visits, unique visits, page views, page visits, page duration and depth, visit duration, bounce rate, and new visits. You’ll get the language, country, and city of your visitors, the browser, operating system, and ISP being used, and mobile visitor info (operating system, service provide, screen resolution). The custom variables section will only provide data if there are custom reports in place, and the visitor flow is a highly stylized graphical representation of visitor navigation behavior through your website pages.
ADVERTISING
AdWords: Campaigns, Keywords, Matched Search Queries, Day Parts, Destination URLs, Placements, Keyword Positions
As you will likely deduce, the advertising section is for those who use AdWords. It will allow you to track everything related to your AdWords campaign, and accordingly can be a great resource (in addition to the AdWords site and Google Webmaster Tools) to manage your campaigns success. If no AdWords campaign is in effect no data will be displayed.
TRAFFIC SOURCES
- Overview
- Sources: All Traffic, Direct, Referrals
- Search: Overview, Organic, Paid, Campaigns
- Search Engine Optimization: Queries, Landing Pages, Geographical Summary
- Social: Overview, Sources, Pages, Conversions, Social Plugins, Social Visitor Flow
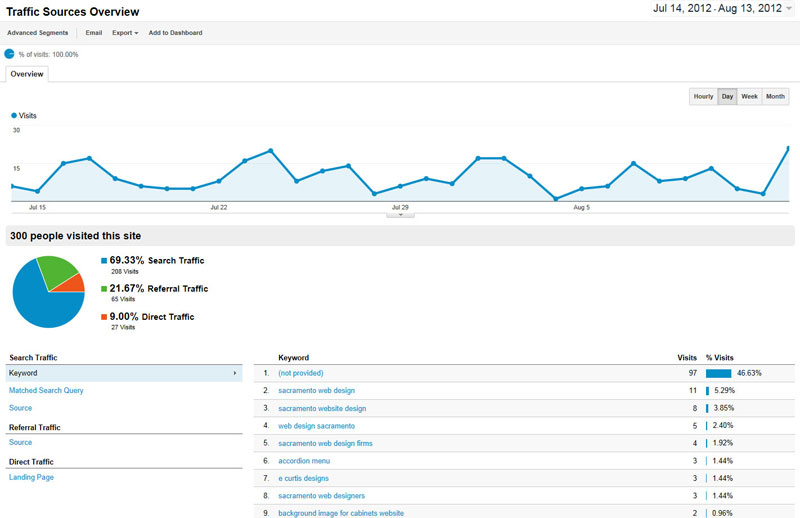
This is the place to get the needed SEO information for site optimization and submission targeting, and is one of the areas we rely on to assist our advanced marketing clients achieve a prominent ranking. This section includes the percentage of search traffic, referral traffic (and the referring domain name), and direct traffic, the keywords provided to locate your website, organic vs. paid search statistics, and AdWords campaigns if applicable. It also includes landing pages (page visitor initially arrives at), a geograpical summary of visitor location, and a Social section wherein you create custom goals, view social referrals, social plugins, and social visitor flow.
CONTENT
- Overview
- Site Content: All Pages, Content Drilldown, Landing Pages, Exit Pages
- Site Speed: Overview, Page Timings, User Timings
- Site Search: Overview, Usage, Search Terms, Pages
- Events: Overview, Top Events, Pages, Events Flow
- AdSense: Overview, AdSense Pages, AdSense Referrers
- Experiments
- In-Page Analytics
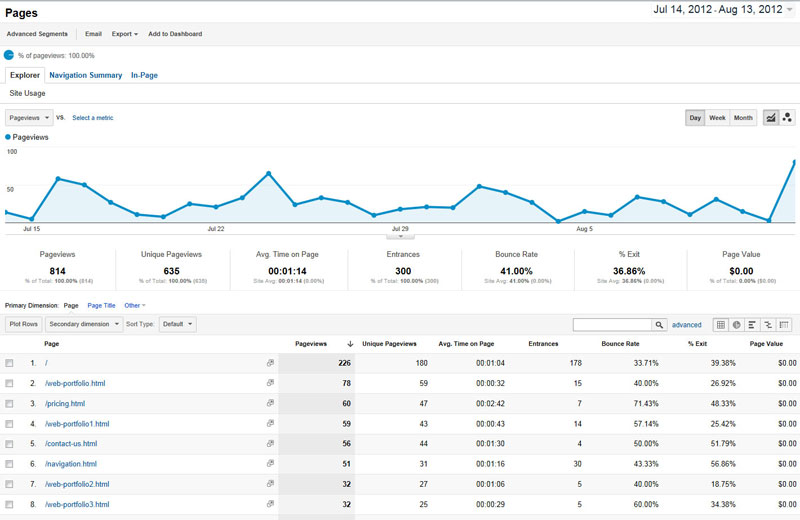
This section provides much of the above content, yet a bit more detailed information. Here we have a listing of the pages visited by frequency (content drilldown), including page views, unique page views, avg. time on page, entrances, bounce rate, exit percentage, and page value (if AdSense is applied). We also have landing and exit pages.
There is a site speed overview and stats for individual pages, a site search page (content provided if you have a search box) which includes usage, search terms, and other information such as total unique searches, results pageviews, search exits, search refinements, time after search, and search depth.
- The Events section is used to record user interaction with website elements, such as a Flash-driven menu system. Event tracking is commonly use for any flash driven element, embedded Ajax page elements, page gadgets, file downloads, and data load times. The data for this section will show only if an event has been targeted by applying the ga.js event tracking code.
- The AdSense section is for tracking AdSense campaigns. It includes an overview section, the AdSense pages, AdSense referrers, etc.
- The Experiment section is rather novel. It allows you to test which page design is more effective for your website visitors. As they note you can experiment on any single page – a landing page, a goal funnel page, or a goal conversion page. The idea is to choose a page to test and design variations of the page (separate URLs for each).
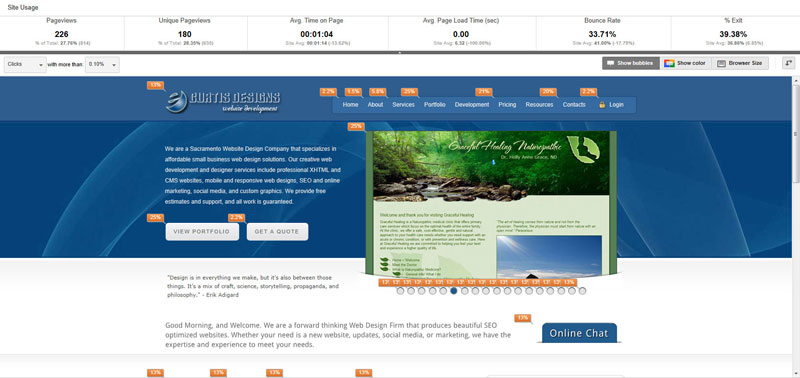
- And finally we have “In-Page Analytics”. This section provides a very fun look at your website in real time. It will load your home page and then provide statistical information about navigation views and clicks by percentage, and provides the dimensions of the page viewable by visitors (browser size).
CONVERSIONS
- Goals: Overview, Goal URLs, Reverse Goal Path, Funnel Visualization, Goal Flow
- Ecommerce: Overview, Product Performance, Sales Performance, Transactions, Time to Purchase
- Multi-Channel Funnels: Overview, Assisted Conversions, Top Conversion Paths, Time Lag, Path Length
This section is concerned with goal conversion. It includes a section on custom goals, and Ecommerce. In case you are wondering what the custom goals are, well, they are used to measure how well your site or app fulfills targeted objectives. You can set up individual Goals for specific actions like visits to a “Thanks for registering” page, a Download completed screen, a minimum visit duration, or a specific purchase amount. The Ecommerce section tracks product performance, sales, transactions, and other related information.


