Tracking user behavior on a website is one of the key components of a good SEO plan. Website tracking with Analytics can let you know many things, such as the number of new and repeat visitors, the visitor location, the Internet browser and device used to view your pages, the landing page (first page visited), the bounce rate (no additional pages visited), the specific pages visited and the “flow” (how they navigated your site), how long they remained on your site, and if conversions happened (sales, buttons/banners clicked, forms submitted, etc). Reviewing this data over time can be very helpful since it will let you know what is working on your site, and what may need to be changed.
If you’ve used Analytics before you will have noted that its features changed significantly about a year back. The main differences I noted were the ability to track mobile visits and the ability to target for specific conditions by applying metrics and filters. At first glance the dashboard can seem a bit daunting, so in this post I wanted to cover the general settings I apply with my accounts, and the stats that are most often useful within their “reports” section.
Account Set-Up
To set up an account you’ll need to have a Google account, which is the same access for all of their properties, Gmail, Webmaster Tools, Calendar, AdWords, AdSense, etc. Assuming you have this you just need to log-in at: https://www.google.com/analytics/ At the top left menu select “Admin”; then select the “Account” drop-down box, and “Create new account”.
The administration area has a lot of setting options so I am only going to reference the ones which I feel are needed for most people.These are:
- What would you like to track? Website
- Account Name: Add your business name
- Website Name: However you want to refer to it
- Website URL: Full URL with https:// or https:// if on a secure server
- Industry Category: Select the one that fits best from their list
- Data Sharing Settings: I select the first two only, the third one is fine if you want tech support help.
You then select the blue button “Get Tracking ID”. At this point you will receive your tracking information, which consists of a JavaScript code string.
Note: The JavaScript code is typically added before the closing </header> tag of every web page you want to track. If your site was developed with WordPress and uses an analytics plugin you will likely just need the UA code, which will be the part that looks like ‘UA-1234567-1’, though many of the better themes include an area within their theme settings section where you will add the entire JavaScript code string as provided by Google. The other option is to use their PHP implementation method, which is easily done by creating the php as noted, and then adding the include to the header.php file.
Note: The header.php file is used by all of the WordPress pages so the Google Analytics include only needs to be added to this one page.
Once the tracking code is added it will take a couple of days to begin seeing the report data.
Account
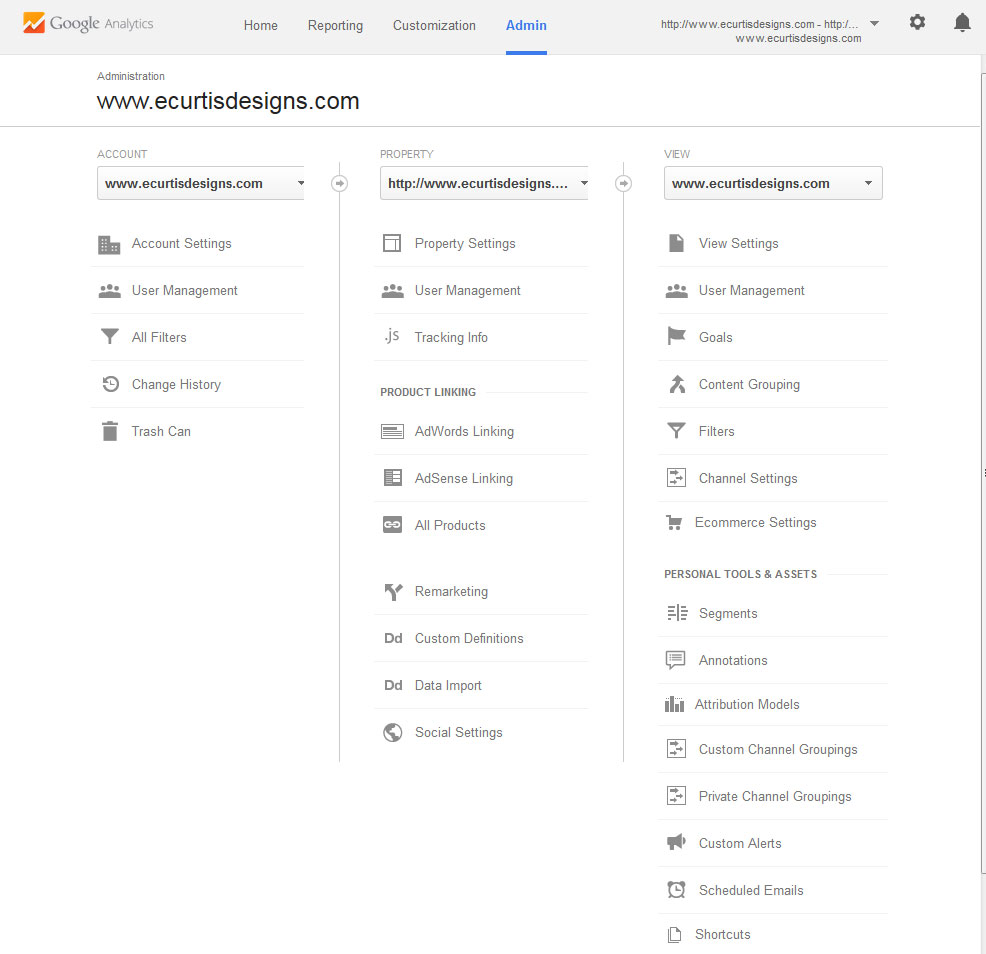
The “Account” link includes the basic settings which you have already set up. User management will be your email, with full access permissions (manage users, edit, collaborate, read and analyze). If wanted you can add one or more persons to the account you can grant them access permission (just need to add their Gmail email and password) and your report will show up in the dashboard when the visit the analytics link; My suggestion though is to set their permissions to “read and analyze” for all but the most trusted to ensure that your account is not compromised.
Property
Under Property Settings you will find more of the basic settings you’ve already configured, and the option of whether you want to enable advertising features (demographic and interest reports) and in-page analytics (to better track links on your pages). I don’t use these features personally, but for some sites they may have value.
The bottom of the property settings section is the “Webmaster Tools” setup area. If you have a webmasters tools account set up select the “adjust webmaster tools” button to ensure that your site’s home page is selected.
At the bottom of the property section is “Social Settings”. Here you simply add the URL for each social option you use for your business, such as https://www.facebook.com/pages/E-Curtis-Designs/112211662171761 (my facebook page).
View
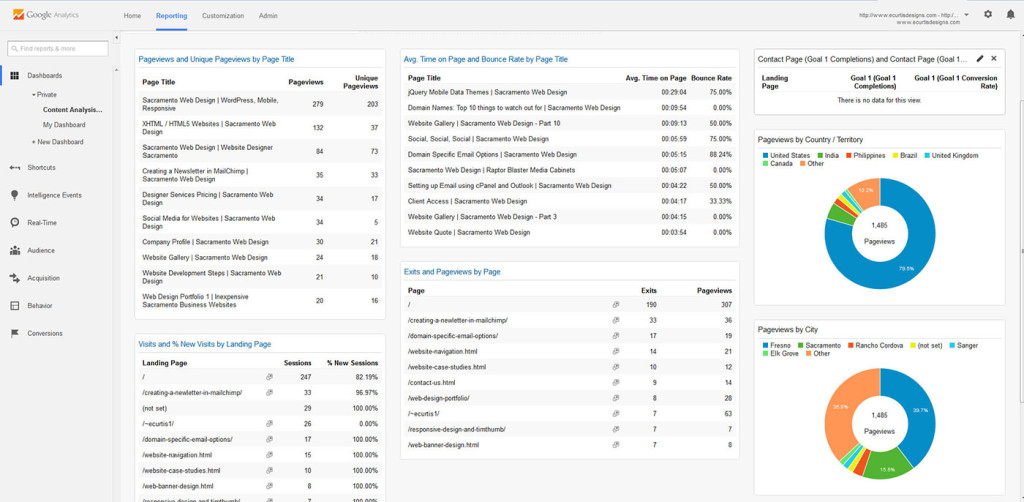
The first two tabs include mostly the same information that has been provided before. The next tab “Goals” is a new option that I personally use, and find very effective. The quick way to include “Goals” is to select “Import from Gallery” and you will find a listing of custom report options. For my site type I am interested in content analysis so I found the one that best met my needs, and that was highly rated. Within this area you can filter the results by category, popularity, etc. Following you can see the report from Goal “custom analysis”. It provides lots of great info!
Of the other tab options, I recommend:
Segments: This section is similar to “Goals”, and allows you further track visitor behavior in a variety of ways (social media, ecommerce, engaged traffic, etc). Import a report that provides the features wanted.
Attribution Models: This section is is also similar to “Goals” and “Segments”, yet now you are able to better track a specific function of your site, such as contact form submission, newsletter subscription, AdWord conversions, brochure download, etc. As with the previous you can import a report that best meets your needs.
Note: For my own website I have the attribution model goal set to contact form submission. Using the “begins with” option I can track my contact page by adding “/inquiries”. I can’t actually track emails sent though (just visits to this page) since my contact form isn’t using a referral page (such as www.mysite.com/email-success.html).
Scheduled Emails: I don’t schedule emails for myself, yet if your site does schedule emails this is where they are shown; scheduled email reports can be extended (6 months or a year). Email scheduling allows you to send out a report on a regular basis (options include pdf, excel, csv, etc). More on scheduling follows in the “reporting” section.
Customization
At the top-left menu “Customization” will show the custom reports you’ve created or imported from the gallery. You can add a new custom report from this section and/or a new category as wanted.
Reporting
Okay, so this is the “informational” part of Analytics. Initially you will arrive at the “Audience Overview”. This in itself is a good general view since it provides the number of visitors, page views, number of pages visited, session duration, bounce rate, language, locations, system used, etc. When viewing the reports noted below I often just visit the overview pages for a section since they will provide a quick view on visitor behavior.
Note: At the upper right there is a date setting, wherein the stats shown will be for a 30 day period. You can select a different type frame from the drop-down provided by using their calendar feature. The line graph shown at top under the Overview heading can also be set from day (default) to hourly, week, and month.
Scheduling Emails: As I noted above, you can send and schedule report emails. Under the heading “Audience Overview” you will see “Email” and “Export”. Export is for saving a report locally to your computer. Email allows you to select a report format, report duration (once, daily, weekly, monthly, quarterly), and for how long (up to one year), and then schedule it to send a report, or a number of reports, to a specific email address.
Okay, so as I noted above I have a variety of additions added to my reports (goals, segments, etc), so for my report I select “Private” from the left menu under “Dashboards”. Here you just click on the dashboard name that you have created or that you have imported previously.
Getting back to the left sidebar menu you will find variety of reporting options. Of these I typically review the stats within “Audience” and “Behavior” only.
Audience
This menu consists of:
- Overview
- Active Users
- Cohort Analysis
- Demographics (overview, age, gender)
- Interests (overview, affinity categories, in-market segments, other categories)
- Geo (language, location)
- Behavior (new vs returning, frequency and recency, engagement)
- Technology (browser and OS, Network)
- Mobile (overview, devices)
- Custom (custom variables, user defined)
- Benchmarking
- User Flow
The reports that are most important will be based upon your type of business. As a rule I like to evaluate new vs. returning visitors, location, browser, user flow (how they navigate the site), and the mobile devices used. Since I do have customization in place there is data under “custom” in my report. In a future blog post I will go into detail on how I track, and why, but I trust that you understand the use of these well enough for now to make use of them.
Behavior
Within this reporting section you will information geared toward a visitors actions within your website. This menu consists of:
- Overview
- Behavior Flow
- Site Content
- All Pages
- Content Drilldown
- Landing Pages
- Exit Pages
- Site Speed
- Overview
- Page Timings
- Speed Suggestions
- User Timings
- Site Search
- Overview
- Usage
- Search Terms
- Pages
- Events
- Overview
- Top Events
- Pages
- Events Flow
- Ad Sense
- Overview
- AdSense Pages
- AdSense Referrers
- Site Content
- Experiments
- In-Page Analytics
I know, lots of reports!  Okay, so it is easy to get a bit overwhelmed with all these reports. I get a similar reaction from many clients when they first learn a bit about SEO requirements …. it can be dizzying. The important thing is to look at the overviews for a given report type first, and then do the content drilldown as needed to define the specifics.
For most businesses you will want to look at:
- Site Content: All four reports
- Site Speed: The first three reports
Note the page “speed suggestion” link can be very helpful. Their performance suggestions are for both desktop and mobile, and you get to see a nifty picture of how your site would look on a laptop, and on a mobile phone (see my site’s mobile pic attached provided by Google Analtyics).
Well, I will leave things here for now. I hope you can see how valuable of a tool (and fun) Google Analytics can be. If you need help with Analytics, from simple set-up (free to existing clients), or custom reports (per my hourly rate), I am pleased to assist you in your site tracking efforts.


